


Tired of power costs and shortages?
Lower your carbon footprint with grid-tie and off grid systems designed to perfectly suit your needs.
Not sure what you need? Contact us to get a quote.

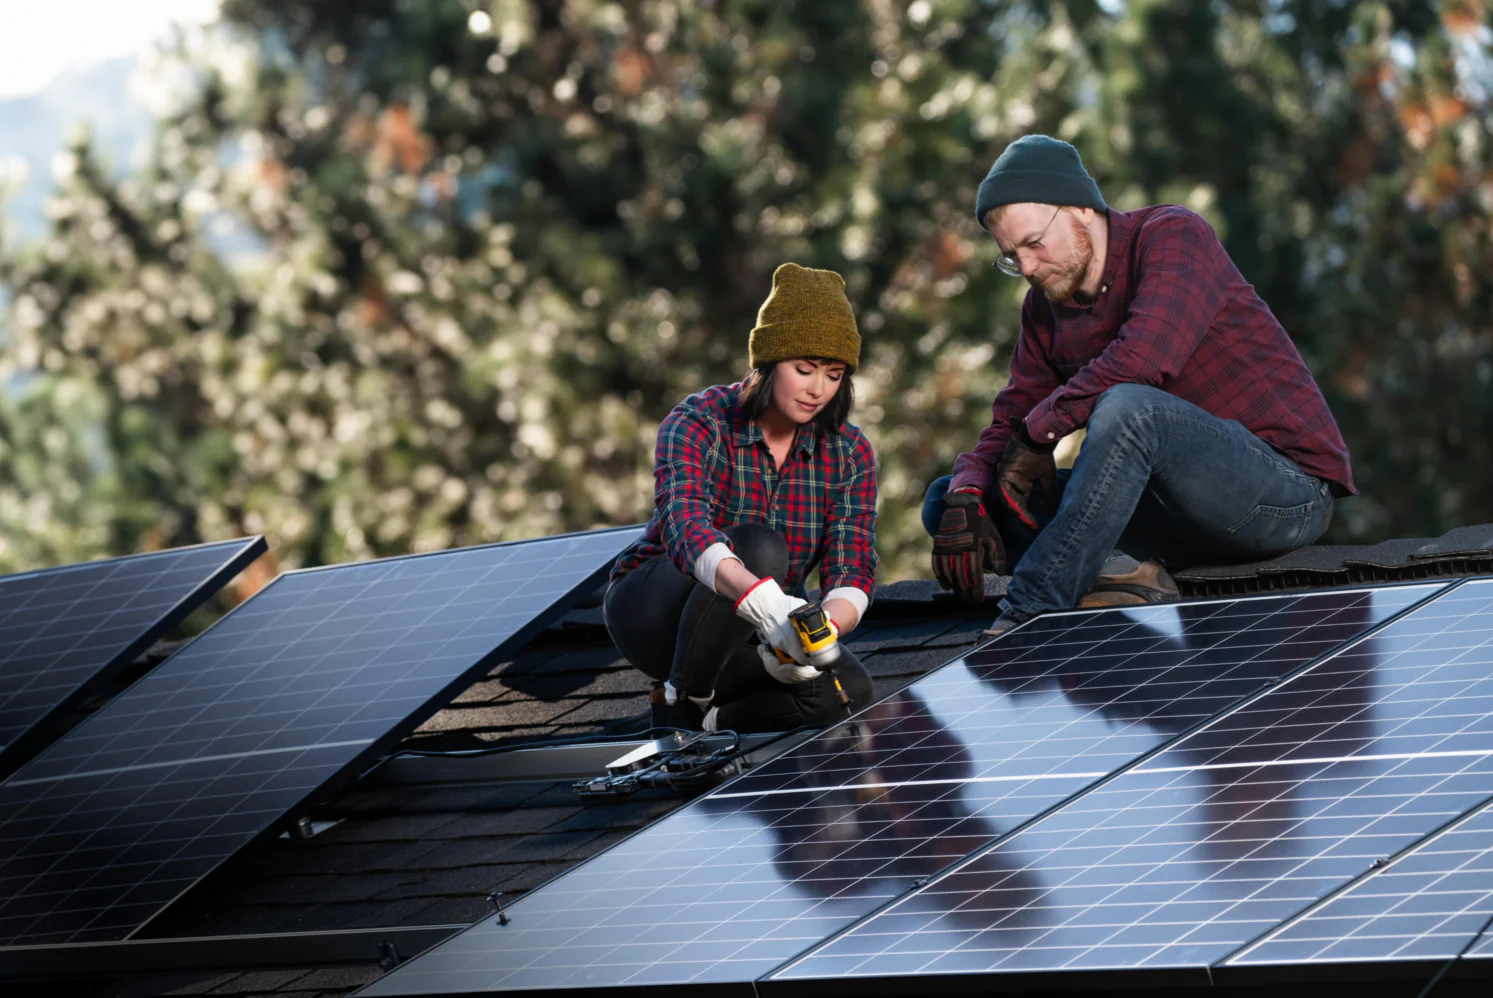
Once I got the plan set, it was easy to install... it was amazing how quick it went once everything was all set up. I knew what to expect, I knew what the inspector would be looking for... you guys were there to back me up, so it was the smartest option for me.
Dan F.

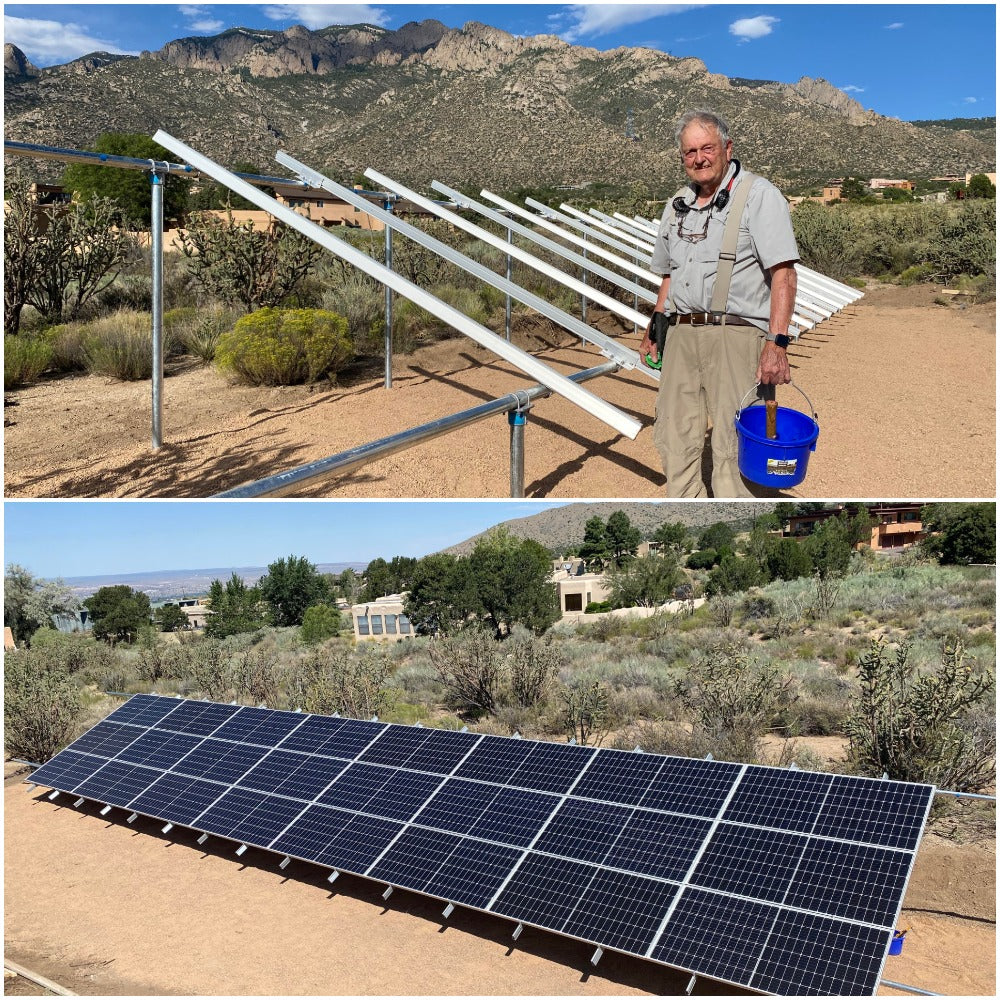
You guys are my guys when it comes to solar. When I got stuck, making a phone call or appointment was one of the huge keys to how well this worked. The confidence and encouragement... it validated that I could do it.
Mike O.

As a DIYer, it's all plug and play, so it's incredibly straightforward... you have certified engineers doing your designs, therefore they're gonna be safe electrically and structurally. That to me is a big peace of mind when I did this.
Tim G.
"Fantastic experiences working with altE."

Get Started with Solar
- Fill Out the Energy Questionnaire
Fill out the questionnaire to see your current energy consumption and determine what kind of system you need. - Get a Quote
We’ll contact you with our recommendations for your package, plus a quote to estimate the investment. - Install with Help
Our tech support team will be available to schedule a call and answer any questions.
ABOUT altE
We’re making solar and battery storage do-able
We know how confusing it can be to set up a solar and battery storage system and find all the right parts. That's why we offer options tailored to your needs. Whether you want to request a quote for a complete solar and battery storage kit or prefer to purchase individual components and figure it out yourself, we've got you covered.
With years of hands-on experience in the industry, we've been helping the world power up with sunshine since 1999.